08-31-2023
| USD/share | |
| Price | 16.30 |
| Dividend | 0.00 |
| Earnings | 1.00 |
| Cash-flow | 2.06 |
| Book value | 12.54 |
| Equity | 12.20 |
PG & E Corp. is part of Electricity business, which is part of Utilities industry. PG & E Corp. is a company from USA, and his stocks are publicly traded.
PG & E Corp. stock dividend
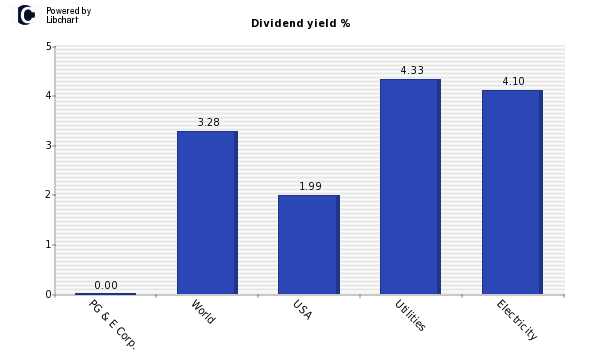
PG & E Corp. paid a total dividend of 0 million USD last year, for a market value of 29,356 millions (Market Cap 29,313 millions). PG & E Corp. dividend per share is 0.00 USD, and his stock market price 16.30 USD.
According to the chart below where dividend yield is displayed, PG & E Corp., has a dividend yield of 0%, amount in contrast with the positive dividend offered by both the market average and companies from USA, Utilities industry, and Electricity sector. This lack of dividends of PG & E Corp. might harm the evolution of share price if the company is not clearly expanding his business.
In addition, you should compare PG & E Corp. stocks dividend with other Electricity companies or other of the high USA dividend stocks list.
PG & E Corp. Dividend Payout
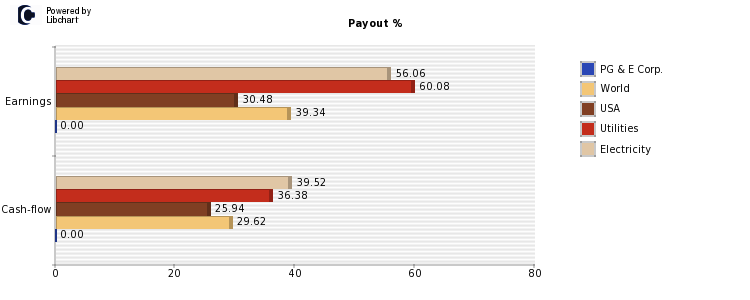
About the ability of PG & E Corp. to maintain his current dividend of USD 0.00 per share, an amount that accounts for 0.00%, we should study its payout ratio both on earnings and on cash-flows (see chart below). PG & E Corp. payout on ernings is currently 0.00%, which is lower than the market average and companies in his industry and sector.
The following figure shows payout ratios over earnings and cashflow of PG & E Corp., compared againt world market average, USA companies, Utilities industry and Electricity sector companies.
PG & E Corp. Dividend History
Below you will find a table with the historical evolution of PG & E Corp.'s dividend stock, both in percentage and in USD, its Payout on Earnings and the number of shares (in case there is an split, number shares altered the dividend per share).
| Year | Yield | USD | Paypout | Shares* |
| Present | 0.00% | 0.00 | 0.00% | 1,801 |
| 2019 | 0.00% | 0.00 | 0.00% | 529 |
| 2018 | 0.00% | 0.00 | 0.00% | 516 |
| 2017 | 0.00% | 0.00 | 0.00% | 511 |
| 2016 | 3.33% | 1.96 | 113.29% | 504 |
| 2015 | 3.45% | 1.82 | 62.12% | 489 |
*In millions
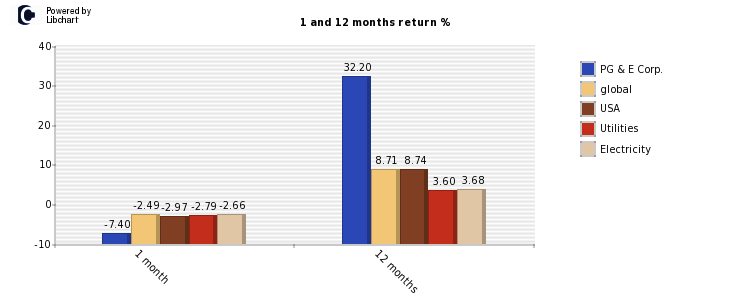
PG & E Corp. Stock performance
Finally, last moth PG & E Corp. showed a return of -7.40% compared to a worldwide -2.49% average, and a -2.79% of Utilities firms. Over the last year, the company obtained a 32.20% versus a worldwide performance of a 8.71%. More detailed information can be seen in the following graph for USA and Electricity firms.