08-31-2023
| EUR/share | |
| Price | 29.61 |
| Dividend | 0.92 |
| Earnings | 3.40 |
| Cash-flow | 7.40 |
| Book value | 37.01 |
| Equity | 35.05 |
Fresenius SE & Co KG is part of Health Care Equip. and Services business, which is part of Health Care industry. Fresenius SE & Co KG is a company from Germany, and his stocks are publicly traded.
Fresenius SE & Co KG stock dividend
Fresenius SE & Co KG paid a total dividend of 518 million EUR last year, for a market value of 16,670 millions (Market Cap 12,175 millions). Fresenius SE & Co KG dividend per share is 0.92 EUR, and his stock market price 29.61 EUR.
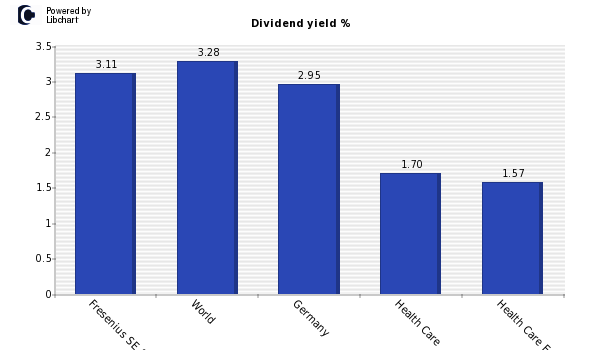
According to the chart below, where dividend yield is displayed, Fresenius SE & Co KG has a dividend yield of 3.11%, which is lower than the amount offered by the market average , but bigger than Health Care industry. Dividend yields are similar among companies from the same industry, so it is a positive sign for the company.
In addition, you should compare Fresenius SE & Co KG stocks dividend with other Health Care Equip. and Services companies or other of the best Germany dividend stocks list.
Fresenius SE & Co KG Dividend Payout
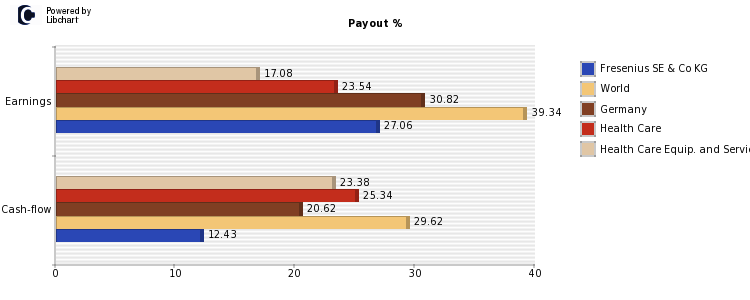
About the ability of Fresenius SE & Co KG to maintain his current dividend of EUR 0.92 per share, an amount that accounts for 3.11%, we should study its payout ratio both on earnings and on cash-flows (see chart below). Fresenius SE & Co KG payout on ernings is currently 27.06%, which is lower than the market average, but higher than companies of Health Care industry, which are 39.34% and 23.54% respectively. Both figures show that Fresenius SE & Co KG is in a good position to keep maintaining his dividend.
The payout on earnings should be complemented with the payout on cash flow since it is this last amount the one which can be distributed to shareholders. Cash flow per share of Fresenius SE & Co KG is EUR 7.40 per share, which is higher than the dividend per share paid by the company of EUR 0.92, so the company generates enough cash to maintain his dividend in the future.
The following figure shows payout ratios over earnings and cashflow of Fresenius SE & Co KG, compared againt world market average, Germany companies, Health Care industry and Health Care Equip. and Services sector companies.
Fresenius SE & Co KG Dividend History
Below you will find a table with the historical evolution of Fresenius SE & Co KG's dividend stock, both in percentage and in EUR, its Payout on Earnings and the number of shares (in case there is an split, number shares altered the dividend per share).
| Year | Yield | EUR | Paypout | Shares* |
| Present | 3.11% | 0.92 | 27.06% | 563 |
| 2022 | 3.50% | 0.92 | 23.12% | 559 |
| 2021 | 2.49% | 0.88 | 23.85% | 558 |
| 2020 | 2.22% | 0.84 | 21.11% | 552 |
| 2019 | 1.59% | 0.80 | 18.65% | 556 |
| 2018 | 1.77% | 0.75 | 19.63% | 555 |
| 2017 | 0.95% | 0.62 | 19.14% | 554 |
| 2016 | 0.81% | 0.55 | 13.96% | 402 |
| 2015 | 0.63% | 0.44 | 15.38% | 431 |
*In millions
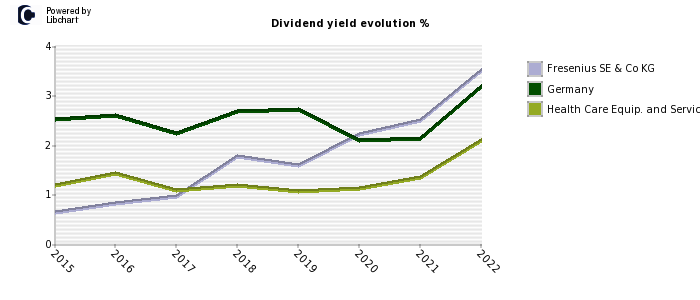
Then you can see the evolution of Fresenius SE & Co KG dividend stock, and compare it with the average of Germany stocks and that of the Health Care Equip. and Services stocks.
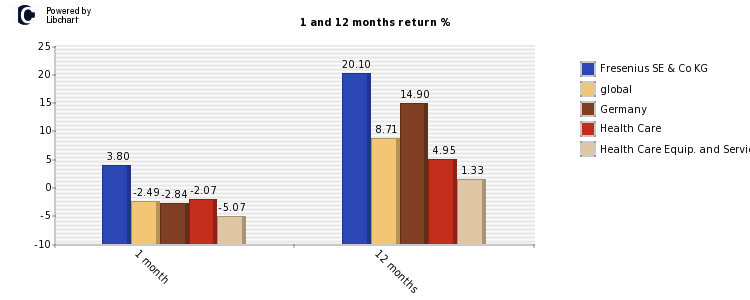
Fresenius SE & Co KG Stock performance
Finally, last moth Fresenius SE & Co KG showed a return of 3.80% compared to a worldwide -2.49% average, and a -2.07% of Health Care firms. Over the last year, the company obtained a 20.10% versus a worldwide performance of a 8.71%. More detailed information can be seen in the following graph for Germany and Health Care Equip. and Services firms.