08-31-2023
| INR/share | |
| Price | 617.00 |
| Dividend | 16.23 |
| Earnings | 51.85 |
| Cash-flow | 57.66 |
| Book value | 237.31 |
| Equity | 220.64 |
Sun TV Network is part of Media business, which is part of Consumer Services industry. Sun TV Network is a company from India, and his stocks are publicly traded.
Sun TV Network stock dividend
Sun TV Network paid a total dividend of 6,395 million INR last year, for a market value of 243,098 millions (Market Cap 60,788 millions). Sun TV Network dividend per share is 16.23 INR, and his stock market price 617.00 INR.
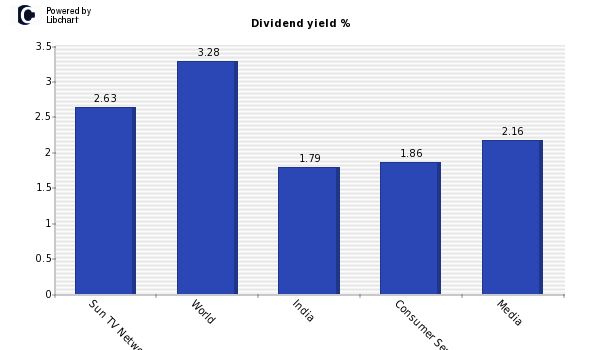
According to the chart below, where dividend yield is displayed, Sun TV Network has a dividend yield of 2.63%, which is lower than the amount offered by the market average , but bigger than Consumer Services industry. Dividend yields are similar among companies from the same industry, so it is a positive sign for the company.
In addition, you should compare Sun TV Network stocks dividend with other Media companies or other of the high India dividend stocks list.
Sun TV Network Dividend Payout
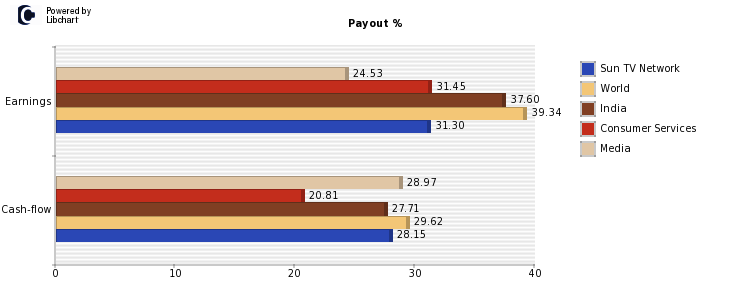
About the ability of Sun TV Network to maintain his current dividend of INR 16.23 per share, an amount that accounts for 2.63%, we should study its payout ratio both on earnings and on cash-flows (see chart below). Sun TV Network payout on ernings is currently 31.30%, which is lower than the market average and companies of Consumer Services industry, which are 39.34% and 31.45% respectively. Both figures lead us to believe that there is confidence that Sun TV Networkcan maintain his current dividend.
The payout on earnings should be complemented with the payout on cash flow since it is this last amount the one which can be distributed to shareholders. Cash flow per share of Sun TV Network is INR 57.66 per share, which is higher than the dividend per share paid by the company of INR 16.23, so the company generates enough cash to maintain his dividend in the future.
The following figure shows payout ratios over earnings and cashflow of Sun TV Network, compared againt world market average, India companies, Consumer Services industry and Media sector companies.
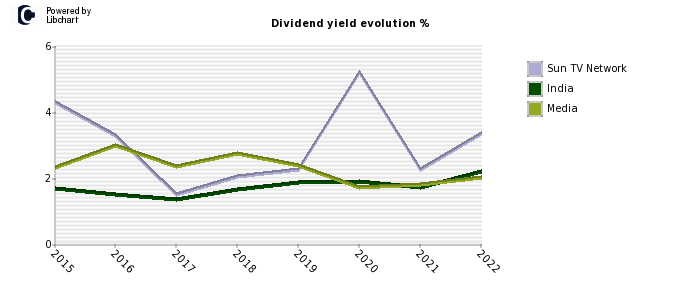
Sun TV Network Dividend History
Below you will find a table with the historical evolution of Sun TV Network's dividend stock, both in percentage and in INR, its Payout on Earnings and the number of shares (in case there is an split, number shares altered the dividend per share).
| Year | Yield | INR | Paypout | Shares* |
| Present | 2.63% | 16.23 | 31.30% | 394 |
| 2022 | 3.34% | 16.25 | 35.06% | 394 |
| 2021 | 2.25% | 11.25 | 24.29% | 394 |
| 2020 | 5.20% | 25.00 | 49.40% | 394 |
| 2019 | 2.26% | 9.98 | 19.43% | 394 |
| 2018 | 2.06% | 12.52 | 32.54% | 394 |
| 2017 | 1.51% | 14.95 | 42.89% | 394 |
| 2016 | 3.29% | 15.49 | 45.40% | 394 |
| 2015 | 4.28% | 17.26 | 51.79% | 394 |
*In millions
Then you can see the evolution of Sun TV Network dividend stock, and compare it with the average of India stocks and that of the Media stocks.
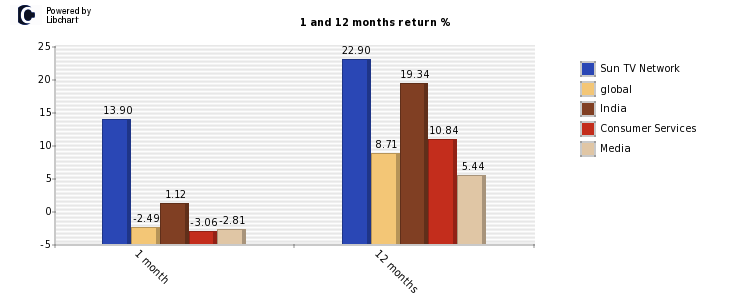
Sun TV Network Stock performance
Finally, last moth Sun TV Network showed a return of 13.90% compared to a worldwide -2.49% average, and a -3.06% of Consumer Services firms. Over the last year, the company obtained a 22.90% versus a worldwide performance of a 8.71%. More detailed information can be seen in the following graph for India and Media firms.