08-31-2023
| HKD/share | |
| Price | 5.36 |
| Dividend | 0.00 |
| Earnings | -0.33 |
| Cash-flow | 0.11 |
| Book value | 10.72 |
| Equity | 12.22 |
Shangri-La Asia is part of Travel and Leisure business, which is part of Consumer Services industry. Shangri-La Asia is a company from Hong-Kong, and his stocks are publicly traded.
Shangri-La Asia stock dividend
Shangri-La Asia paid a total dividend of 0 million HKD last year, for a market value of 19,221 millions (Market Cap 5,925 millions). Shangri-La Asia dividend per share is 0.00 HKD, and his stock market price 5.36 HKD.
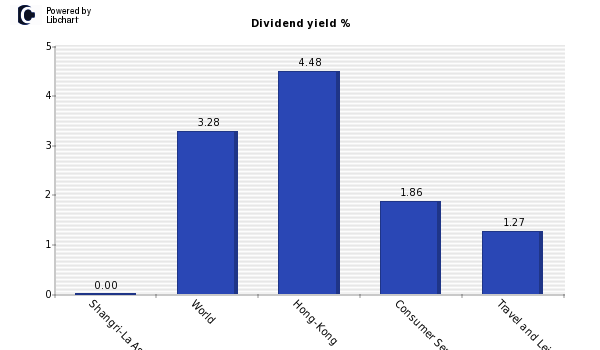
According to the chart below where dividend yield is displayed, Shangri-La Asia, has a dividend yield of 0%, amount in contrast with the positive dividend offered by both the market average and companies from Hong-Kong, Consumer Services industry, and Travel and Leisure sector. This lack of dividends of Shangri-La Asia might harm the evolution of share price if the company is not clearly expanding his business.
In addition, you should compare Shangri-La Asia stocks dividend with other Travel and Leisure companies or other of the high Hong-Kong dividend stocks list.
Shangri-La Asia Dividend Payout
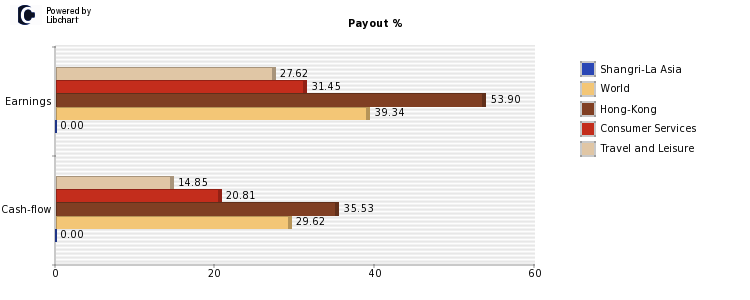
About the ability of Shangri-La Asia to maintain his current dividend of HKD 0.00 per share, an amount that accounts for 0.00%, we should study its payout ratio both on earnings and on cash-flows (see chart below). Shangri-La Asia payout on ernings is currently 0.00%, which is lower than the market average and companies in his industry and sector.
The following figure shows payout ratios over earnings and cashflow of Shangri-La Asia, compared againt world market average, Hong-Kong companies, Consumer Services industry and Travel and Leisure sector companies.
Shangri-La Asia Dividend History
Below you will find a table with the historical evolution of Shangri-La Asia's dividend stock, both in percentage and in HKD, its Payout on Earnings and the number of shares (in case there is an split, number shares altered the dividend per share).
| Year | Yield | HKD | Paypout | Shares* |
| Present | 0.00% | 0.00 | 0.00% | 3,586 |
| 2022 | 0.00% | 0.00 | 0.00% | 3,586 |
| 2021 | 0.00% | 0.00 | 0.00% | 3,586 |
| 2020 | 0.00% | 0.00 | 0.00% | 3,586 |
| 2019 | 2.70% | 0.22 | 52.38% | 3,586 |
| 2018 | 1.64% | 0.19 | 54.29% | 3,585 |
| 2017 | 0.79% | 0.14 | 60.87% | 3,580 |
| 2016 | 1.18% | 0.10 | 32.26% | 3,580 |
| 2015 | 1.53% | 0.11 | 25.58% | 3,580 |
*In millions
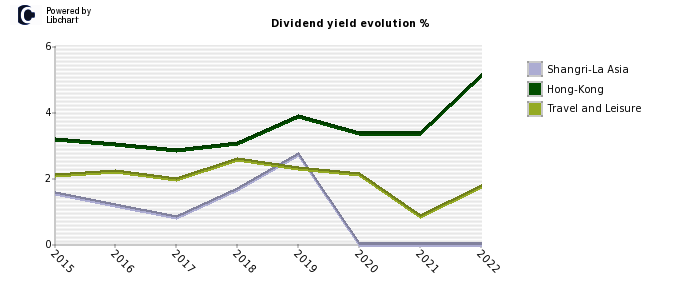
Then you can see the evolution of Shangri-La Asia dividend stock, and compare it with the average of Hong-Kong stocks and that of the Travel and Leisure stocks.
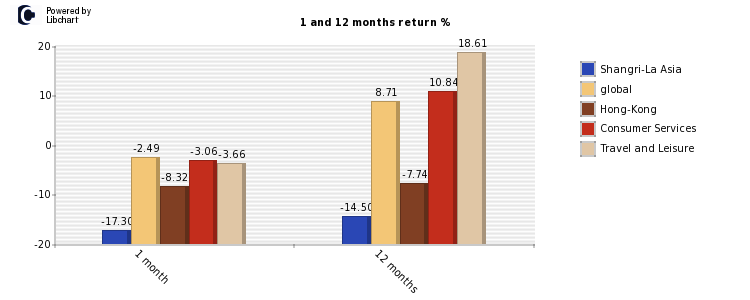
Shangri-La Asia Stock performance
Finally, last moth Shangri-La Asia showed a return of -17.30% compared to a worldwide -2.49% average, and a -3.06% of Consumer Services firms. Over the last year, the company obtained a -14.50% versus a worldwide performance of a 8.71%. More detailed information can be seen in the following graph for Hong-Kong and Travel and Leisure firms.