08-31-2023
| USD/share | |
| Price | 939.70 |
| Dividend | 0.00 |
| Earnings | 35.33 |
| Cash-flow | 51.07 |
| Book value | -17.24 |
| Equity | 0.00 |
O Reilly Auto is part of General Retailers business, which is part of Consumer Services industry. O Reilly Auto is a company from USA, and his stocks are publicly traded.
O Reilly Auto stock dividend
O Reilly Auto paid a total dividend of 0 million USD last year, for a market value of 58,261 millions (Market Cap 57,274 millions). O Reilly Auto dividend per share is 0.00 USD, and his stock market price 939.70 USD.
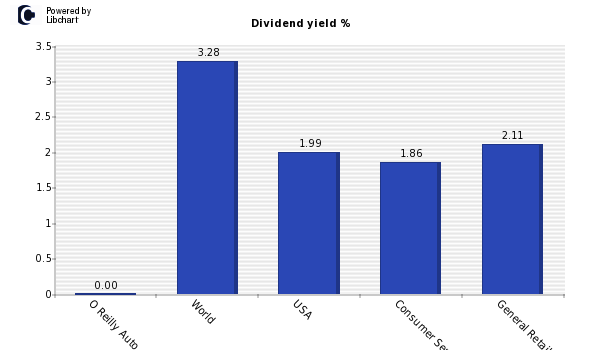
According to the chart below where dividend yield is displayed, O Reilly Auto, has a dividend yield of 0%, amount in contrast with the positive dividend offered by both the market average and companies from USA, Consumer Services industry, and General Retailers sector. This lack of dividends of O Reilly Auto might harm the evolution of share price if the company is not clearly expanding his business.
In addition, you should compare O Reilly Auto stocks dividend with other General Retailers companies or other of the best USA dividend stocks list.
O Reilly Auto Dividend Payout
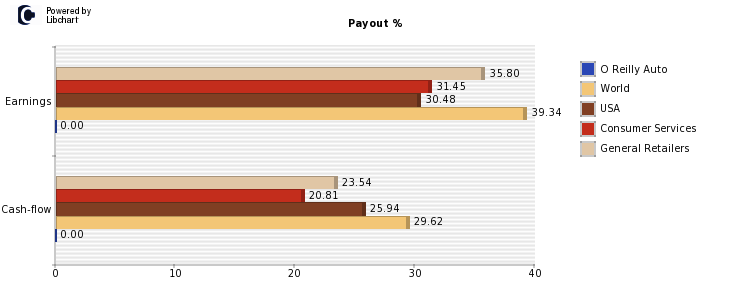
About the ability of O Reilly Auto to maintain his current dividend of USD 0.00 per share, an amount that accounts for 0.00%, we should study its payout ratio both on earnings and on cash-flows (see chart below). O Reilly Auto payout on ernings is currently 0.00%, which is lower than the market average and companies in his industry and sector.
The following figure shows payout ratios over earnings and cashflow of O Reilly Auto, compared againt world market average, USA companies, Consumer Services industry and General Retailers sector companies.
O Reilly Auto Dividend History
Below you will find a table with the historical evolution of O Reilly Auto's dividend stock, both in percentage and in USD, its Payout on Earnings and the number of shares (in case there is an split, number shares altered the dividend per share).
| Year | Yield | USD | Paypout | Shares* |
| Present | 0.00% | 0.00 | 0.00% | 62 |
| 2022 | 0.00% | 0.00 | 0.00% | 63 |
| 2021 | 0.00% | 0.00 | 0.00% | 67 |
| 2020 | 0.00% | 0.00 | 0.00% | 72 |
| 2019 | 0.00% | 0.00 | 0.00% | 76 |
| 2018 | 0.00% | 0.00 | 0.00% | 81 |
| 2017 | 0.00% | 0.00 | 0.00% | 85 |
| 2016 | 0.00% | 0.00 | 0.00% | 95 |
| 2015 | 0.00% | 0.00 | 0.00% | 99 |
*In millions
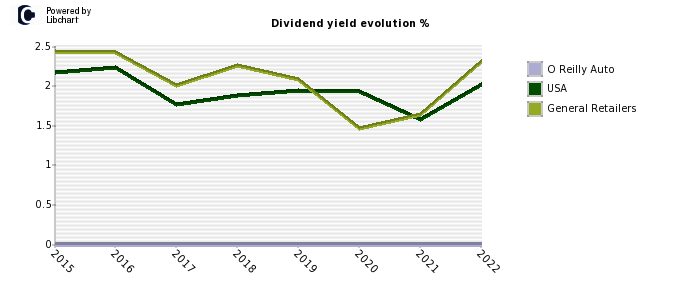
Then you can see the evolution of O Reilly Auto dividend stock, and compare it with the average of USA stocks and that of the General Retailers stocks.
O Reilly Auto Stock performance
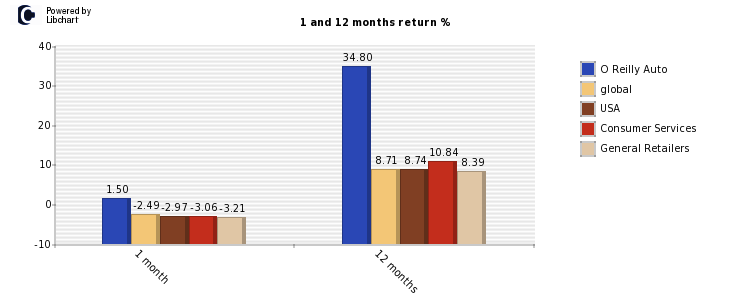
Finally, last moth O Reilly Auto showed a return of 1.50% compared to a worldwide -2.49% average, and a -3.06% of Consumer Services firms. Over the last year, the company obtained a 34.80% versus a worldwide performance of a 8.71%. More detailed information can be seen in the following graph for USA and General Retailers firms.