08-31-2023
| GBP/share | |
| Price | 55.24 |
| Dividend | 0.79 |
| Earnings | 3.29 |
| Cash-flow | 1.89 |
| Book value | 10.83 |
| Equity | 10.03 |
Ashtead Group is part of Support Services business, which is part of Industrials industry. Ashtead Group is a company from UK, and his stocks are publicly traded.
Ashtead Group stock dividend
Ashtead Group paid a total dividend of 347 million GBP last year, for a market value of 24,250 millions (Market Cap 24,086 millions). Ashtead Group dividend per share is 0.79 GBP, and his stock market price 55.24 GBP.
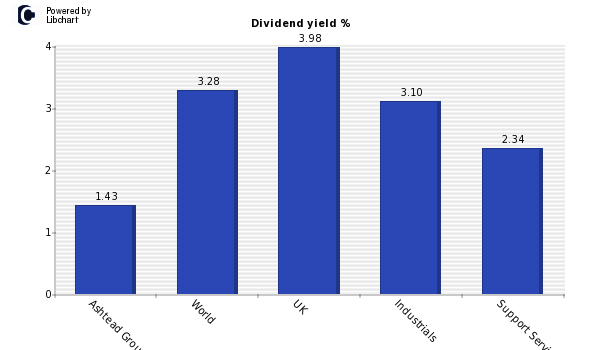
According to the chart below, where dividend yield is displayed, Ashtead Group has a dividend yield of 1.43%, lower than the amount offered by both the market average and companies from UK. It is also lower than average of Industrials industry. This low dividend yield might has several explanations: company overpriced, expanding their business,...
In addition, you should compare Ashtead Group stocks dividend with other Support Services companies or other of the high UK dividend stocks list.
Ashtead Group Dividend Payout
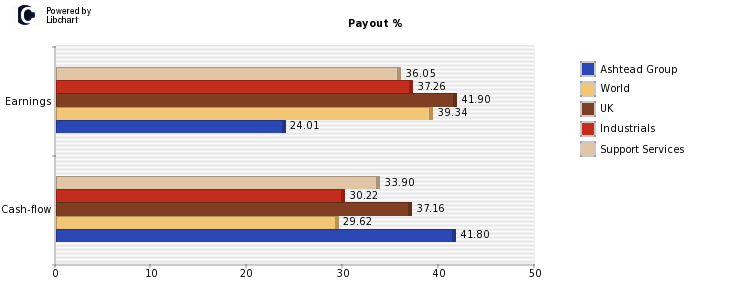
About the ability of Ashtead Group to maintain his current dividend of GBP 0.79 per share, an amount that accounts for 1.43%, we should study its payout ratio both on earnings and on cash-flows (see chart below). Ashtead Group payout on ernings is currently 24.01%, which is lower than the market average and companies of Industrials industry, which are 39.34% and 37.26% respectively. Both figures lead us to believe that there is confidence that Ashtead Groupcan maintain his current dividend.
The payout on earnings should be complemented with the payout on cash flow since it is this last amount the one which can be distributed to shareholders. Cash flow per share of Ashtead Group is GBP 1.89 per share, which is higher than the dividend per share paid by the company of GBP 0.79, so the company generates enough cash to maintain his dividend in the future.
The following figure shows payout ratios over earnings and cashflow of Ashtead Group, compared againt world market average, UK companies, Industrials industry and Support Services sector companies.
Ashtead Group Dividend History
Below you will find a table with the historical evolution of Ashtead Group's dividend stock, both in percentage and in GBP, its Payout on Earnings and the number of shares (in case there is an split, number shares altered the dividend per share).
| Year | Yield | GBP | Paypout | Shares* |
| Present | 1.43% | 0.79 | 24.01% | 439 |
| 2022 | 1.36% | 0.64 | 28.19% | 444 |
| 2021 | 0.71% | 0.42 | 24.85% | 449 |
| 2020 | 1.18% | 0.41 | 23.03% | 449 |
| 2019 | 1.66% | 0.40 | 21.51% | 457 |
| 2018 | 2.02% | 0.33 | 25.19% | 481 |
| 2017 | 1.38% | 0.27 | 25.47% | 499 |
| 2016 | 1.44% | 0.23 | 26.74% | 503 |
| 2015 | 1.39% | 0.15 | 23.81% | 503 |
*In millions
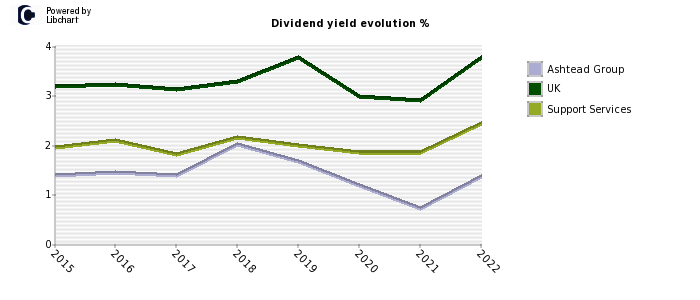
Then you can see the evolution of Ashtead Group dividend stock, and compare it with the average of UK stocks and that of the Support Services stocks.
Ashtead Group Stock performance
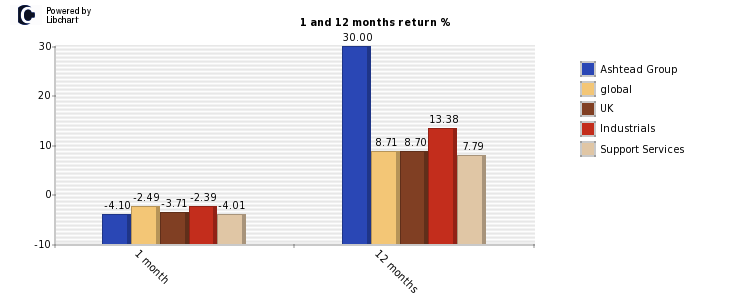
Finally, last moth Ashtead Group showed a return of -4.10% compared to a worldwide -2.49% average, and a -2.39% of Industrials firms. Over the last year, the company obtained a 30.00% versus a worldwide performance of a 8.71%. More detailed information can be seen in the following graph for UK and Support Services firms.